
What Engineers & Designers
Are Building With LOOMIA
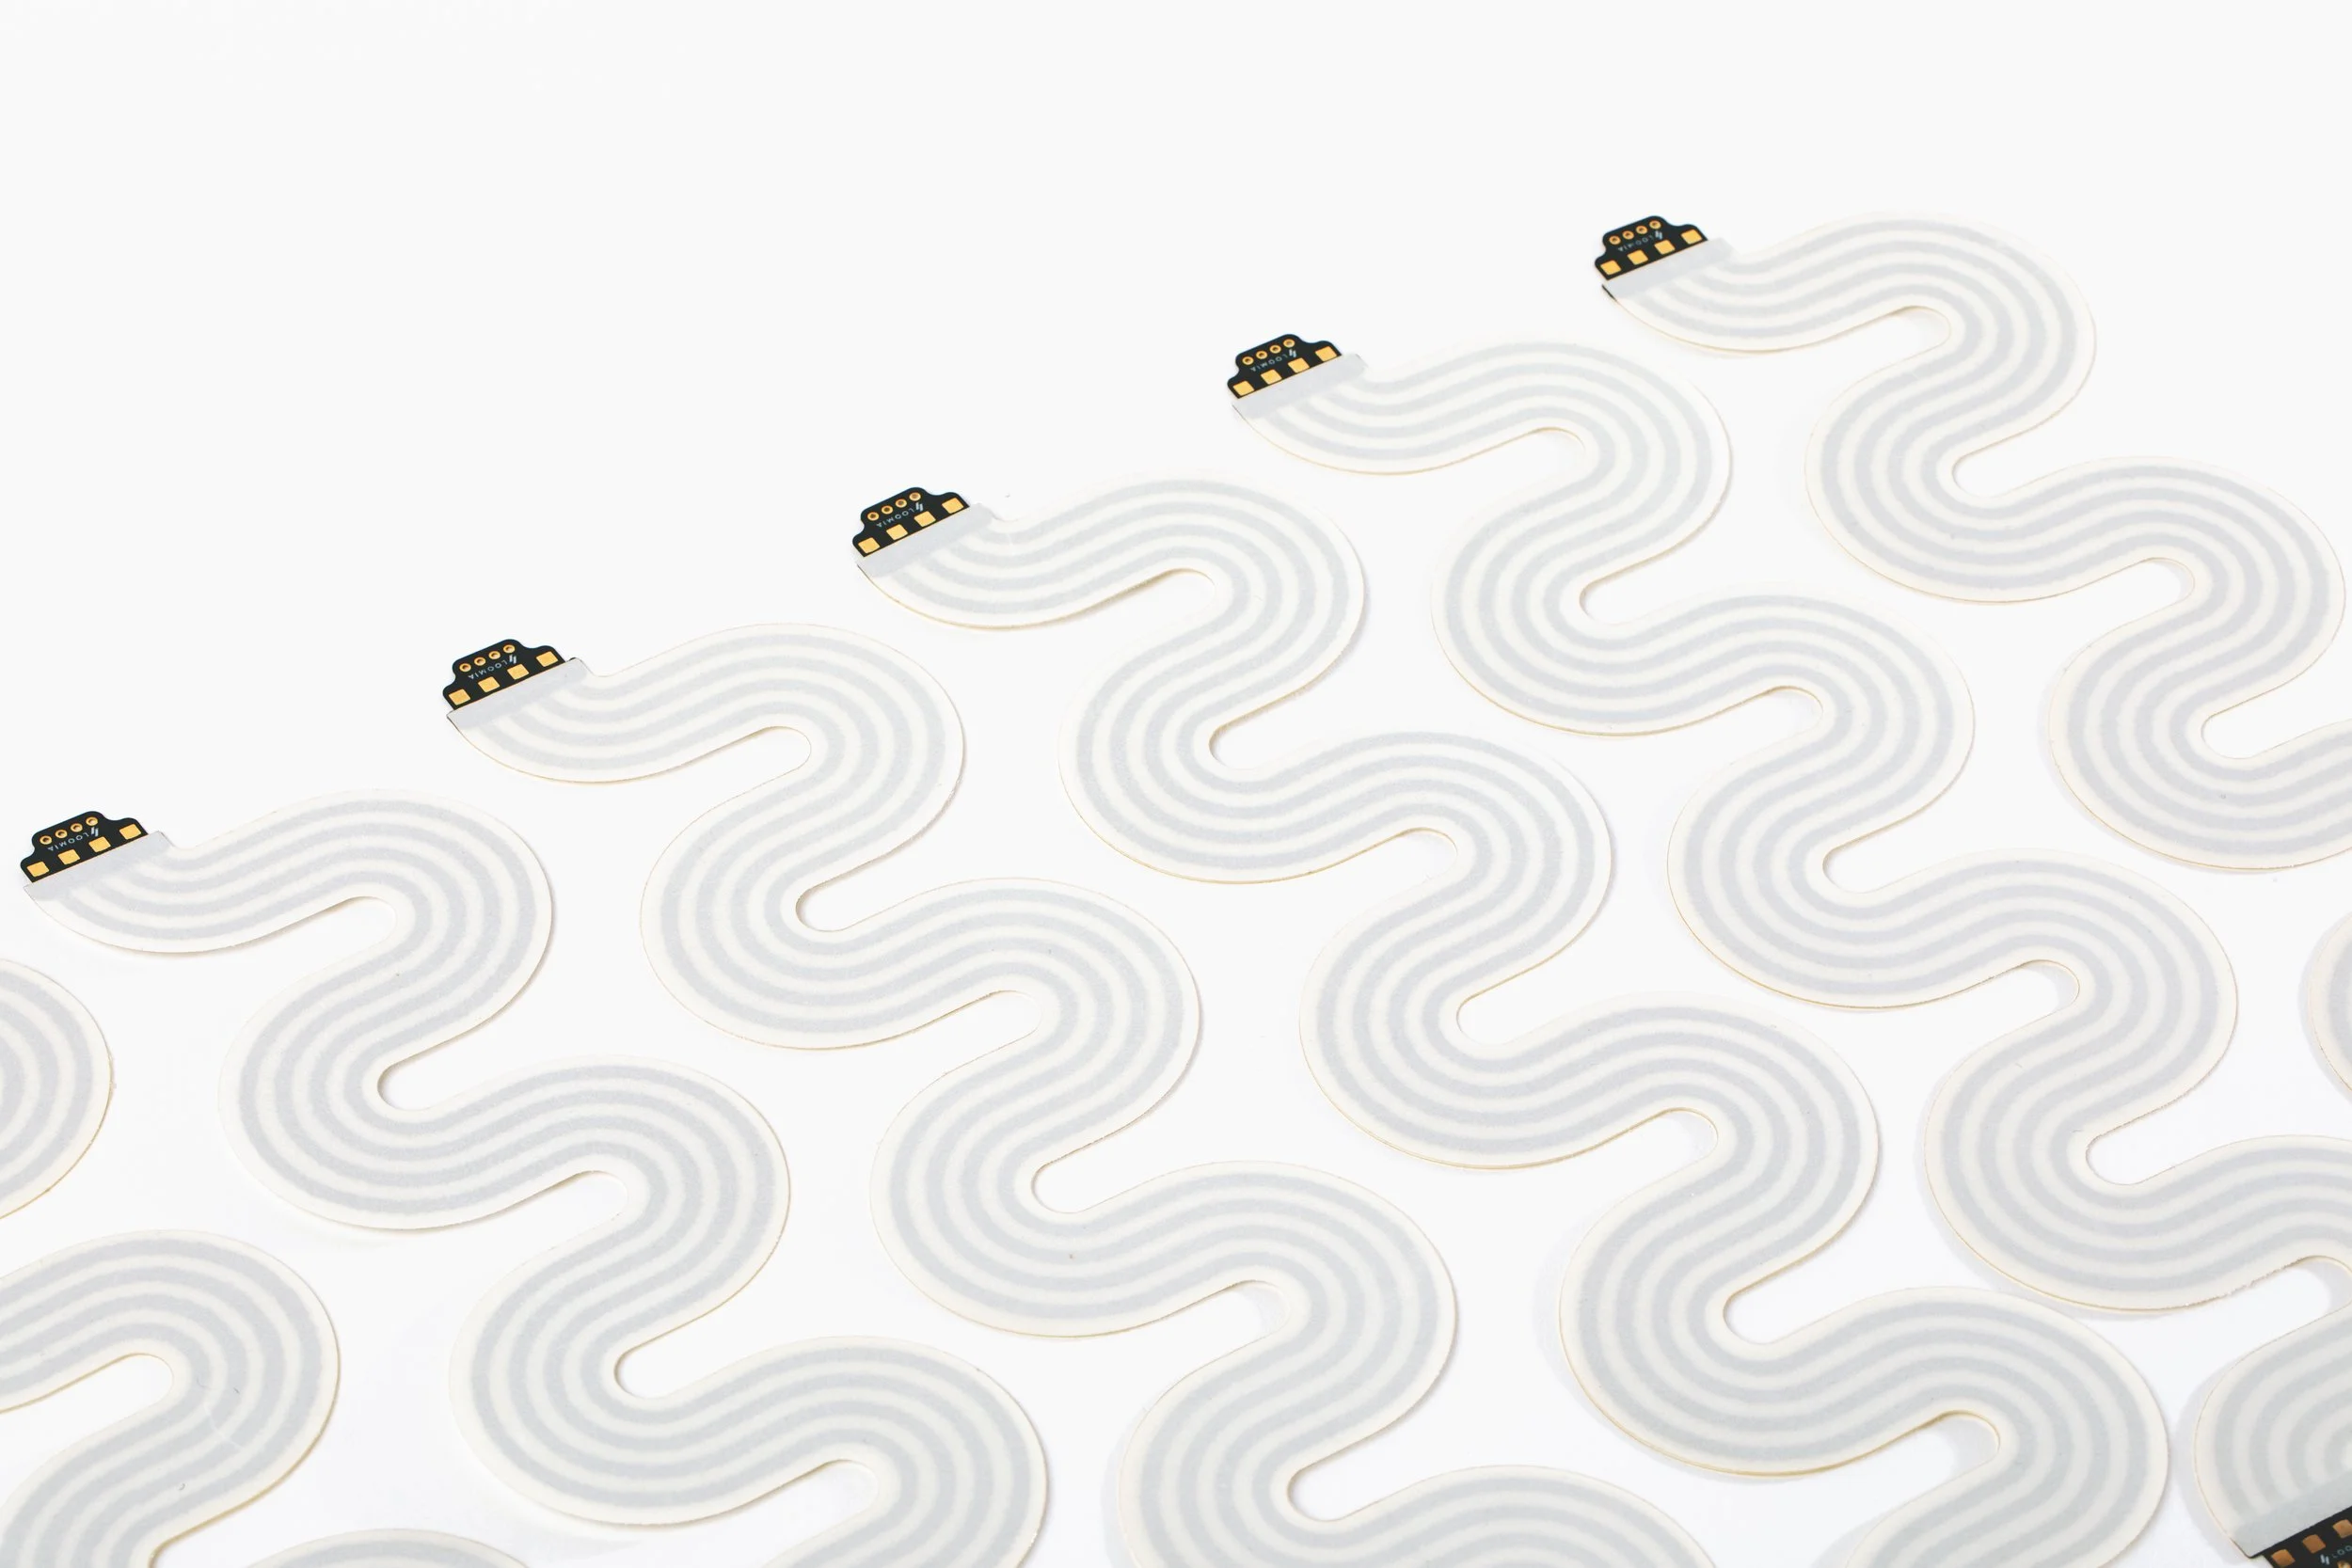
From automotive interiors to robotic end effectors, teams across industries rely on the Loomia Electronic Layer, a flexible circuit for tactile sensors, flexible heaters, e-textiles, and more.
TRUSTED BY TEAMS AT
Hyundai Cradle
FESTO
Analog Devices
Yanfeng
AFFOA
Covestro
Client Reviews
“Working with the team at LOOMIA is a great pleasure; they hustle to get it done and have the greatest knowledge on cutting-edge techniques, totally the best!”
David Monteith, Director of Product Management at Flextronics [Former Customer]
...Maddy and her team are truly exceptional - hardworking, a pleasure to be around, and always pushing the boundaries on what's possible…."
Lauren Baum, Product Marketing Manager,
Google [Former Customer]
"Loomia is top-notch! They incredibly strong grasp of both electronics and textiles, and are leading the way in the smart textiles industry. It was a dream working with them!"
Ben Cooper, Sr Manager, Research & Testing,
VF Corporation Global Innovation [Former Customer]