
Loomia’s Ultimate Guide to Reliable FSR Testing
Rethinking the Old-School Force Sensitive Resistor (FSR) Testing Method
If you've worked with Force-Sensitive Resistors (FSRs), you’ve likely encountered the dead weight method—placing a static weight on the sensor and recording a resistance reading with a multimeter or an Arduino. At first glance, this seems logical: weight applies force, and force should correlate with resistance.
But in reality? This method is deeply flawed.
The Problem with Traditional Force Sensor Testing
The performance of an FSR is influenced by multiple factors beyond just force. Time, contact area, material stiffness, and weight placement all introduce inconsistencies that make simple resistance readings unreliable.
Interlink Electronics, a major tactile sensor and FSR manufacturer, warns against this very issue:
“FSR response is very sensitive to the distribution of the applied force. In general, this precludes the use of dead weights for characterization since exact duplication of the weight distribution is rarely repeatable cycle-to-cycle.”
What does this mean in practice? If you repeat the same test multiple times, your readings can still vary significantly, simply due to minute differences in force application.
Key Factors That Impact FSR Measurements
FSRs don’t behave like rigid load cells. Three key challenges make traditional testing methods inconsistent:
Time Dependence - Resistance Changes over time :
FSRs do not produce instant, stable resistance values. Instead, they exhibit creep, where the resistance slowly decreases under constant force. Here’s an example dataset where a 100g weight was placed on an Interlink FSR 406:Time Since Placement (s) Resistance (kΩ)
5 7.81
10 7.54
30 7.03
60 6.82
Over 60 seconds, the resistance dropped by 12%—without any change in applied force!
Weight Placement – Small Movements Cause Big Swings
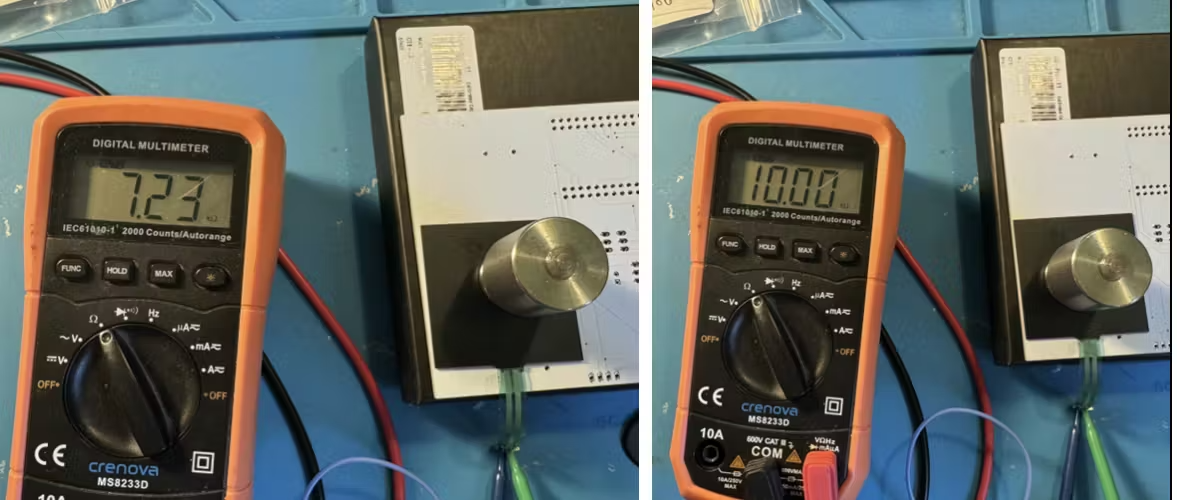
A minor shift in weight placement on the FSR can cause up to a 27% variation in readings. This inconsistency makes it nearly impossible to compare sensors accurately unless placement is strictly controlled.
3. Contact Shape and Area – More Than Just Weight Matters
If you press a weight onto an FSR using a sharp object versus a flat surface, you’ll see drastically different readings—even with the same total force applied. This happens because FSRs measure pressure (force per unit area), not just force.
For example:
A 100g weight applied over 1 cm² exerts twice the pressure as the same weight spread over 2 cm².
A 100g weight applied over 1 cm² exerts twice the pressure as the same weight spread over 2 cm².
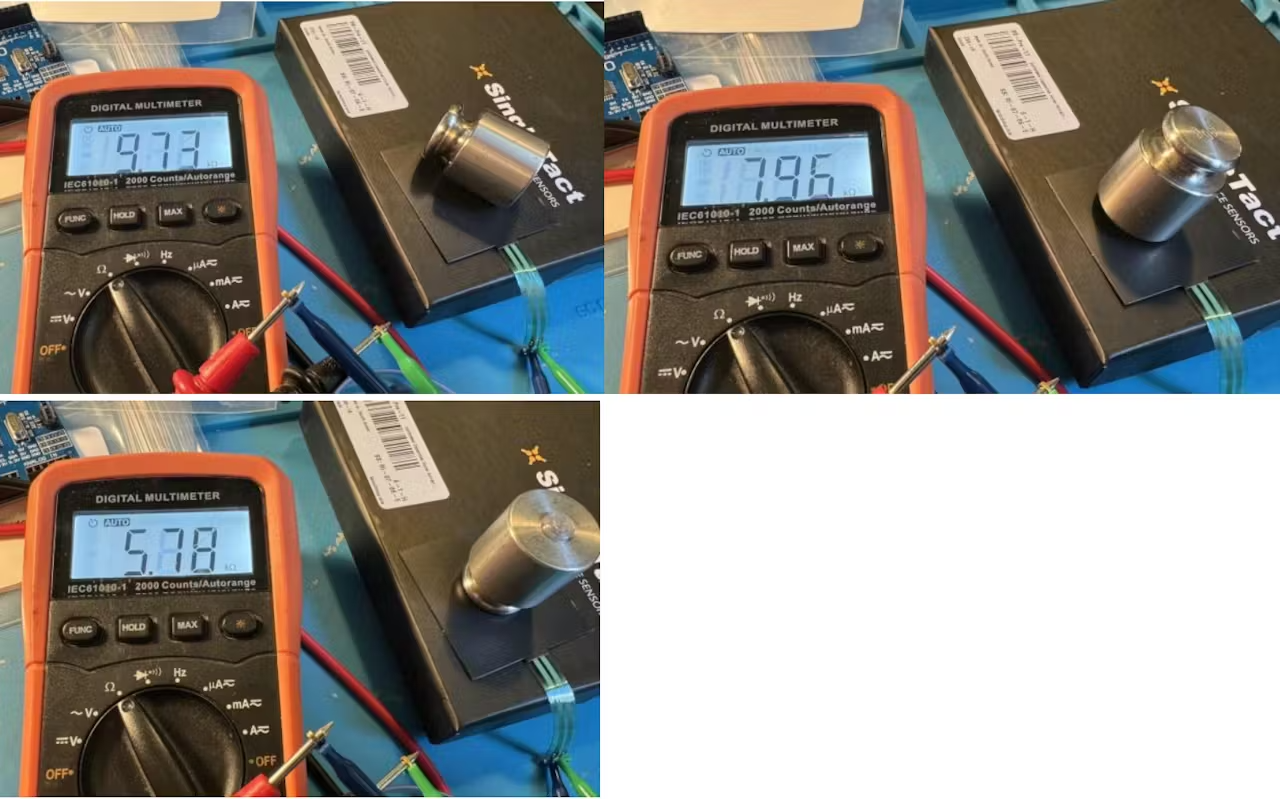
Even minor texture differences in the weight’s contact surface can cause variation.
We tested this by placing a dime versus a sewing button of the same diameter under the weight—both gave different readings because of their different weight distributions!
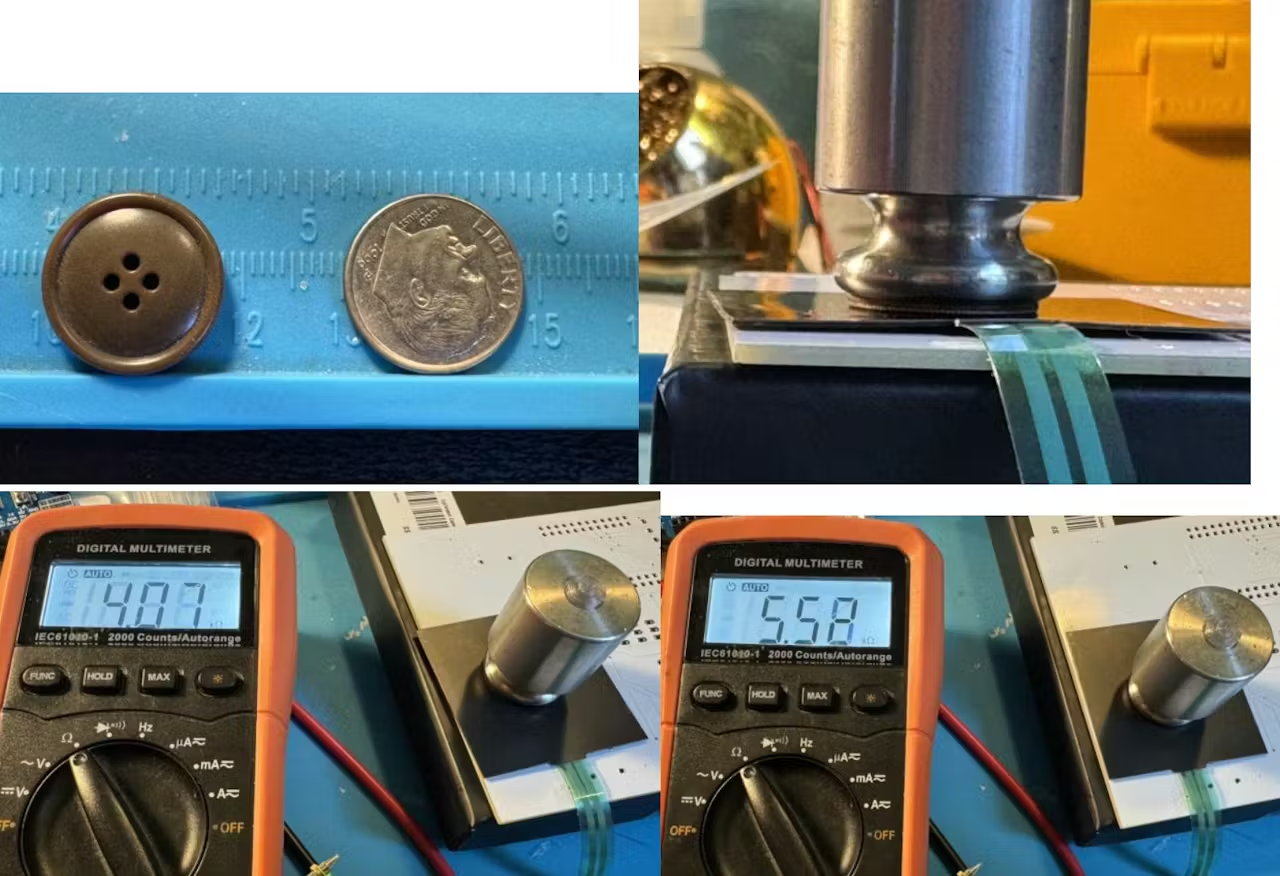
See how the different placement of the same weight also changes the force reading on the sensor.
A New, More Reliable FSR or Tactile Sensor Test Methodology using Arduino
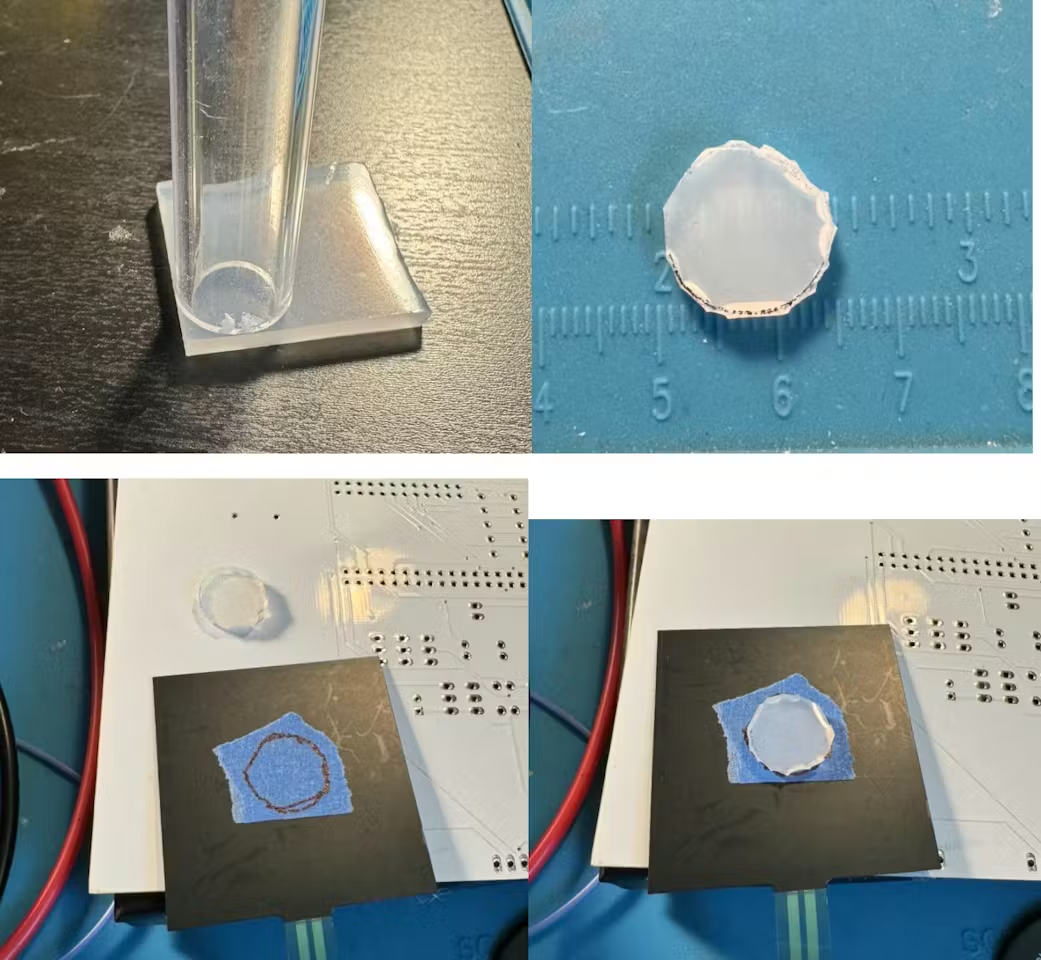
1. Standardizing Contact Area with a Silicone Spacer
To eliminate inconsistency in force distribution, we introduced a soft silicone spacer:
✔ Material: Shore 60A silicone
✔ Size: 0.5” diameter, 1/8” thick
✔ Purpose: Ensures force is evenly distributed across the sensor
With the spacer in place, resistance readings became significantly more stable.
2. Capturing Resistance Over Time Instead of a Single Value by using an Arduino
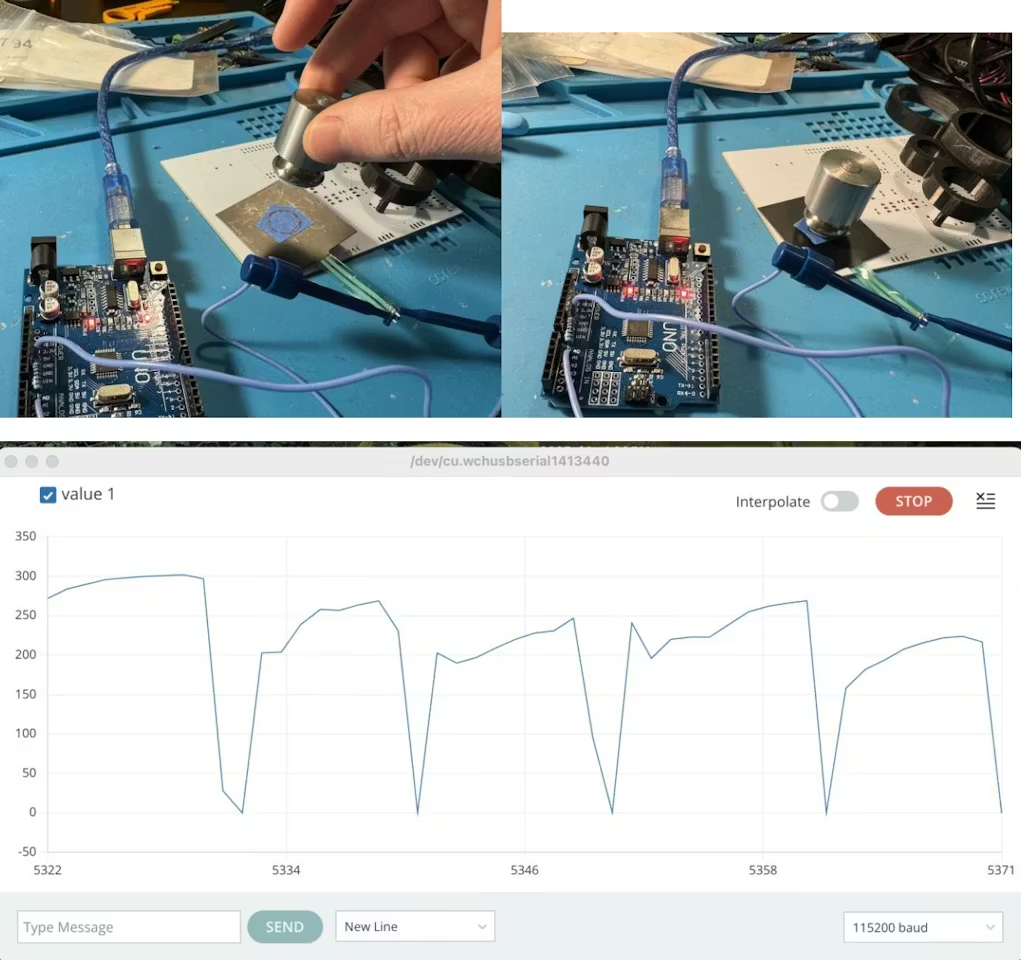
Instead of taking a single resistance snapshot, we plot resistance over time using an Arduino to account for the time-dependent behavior of FSRs.
We also set an automated time window to extract a stable reading. The best moment to capture resistance appears to be:
Between 1000-2000ms after resistance change flattens
After the slope of the curve drops below 1
This ensures repeatable, comparable results across tests.
3. Automating Resistance Measurements with an Arduino UNO
We built a custom test rig using an Arduino UNO to:
✅ Measure FSR resistance using an analog-to-digital converter (ADC)
✅ Log resistance data over time
✅ Apply calibration to convert ADC readings into actual impedance
Key Challenge: ADC Readings Are Not Linearly Proportional to Resistance
Because the FSR and a 1kΩ pull-down resistor form a voltage divider, ADC readings don’t perfectly correlate with actual resistance.
To solve this, we ran calibration tests with known resistances and interpolated the ADC-to-impedance relationship. Here’s a snippet of our calibration table:
Known Resistance (Ω) ADC Reading
218, 000 1
99, 100 7
32, 800 27
9, 560 90
1, 990 340
995 512
497 683
12 910
Using this data, we developed a custom interpolation function to accurately map ADC readings to resistance values.
Results: A Repeatable and Robust Tactile Sensor / FSR Testing Approach
By integrating the silicone spacer, time-dependent measurement, and Arduino-based automation, we created a testing methodology that:
✔ Reduces force distribution inconsistencies
✔ Accounts for resistance creep over time
✔ Provides repeatable, comparable measurements
Next Steps
Fine-tune calibration: Further testing needed to refine our ADC-to-resistance equation
Expand test setup: Automate multi-weight and multi-sensor testing
Improve sensor repeatability: Investigate environmental factors (e.g., temperature, humidity)
Final Thoughts
If you’re working with tactile sensors or FSRs, you must move beyond the simple weight-and-multimeter approach. By implementing a controlled test setup with an Arduino, you can extract useful, repeatable data and make informed engineering decisions.
Do you have experience testing force sensors? Have you found other effective methods? Visit our website to check out Loomia’s force-sensitive resistor technology.